While we were talking about activity ideas, I remembered a project I had done with elementary students when they were learning about maps in social studies. Students were given an unlabeled map of the library and had to fill it in - forcing them to walk around the space and really study what was there. We could definitely make this work for high school students, but I knew right away we’d need to make it a digital assessment - reviewing maps from a few fourth grade teams is one thing, but 500 high school students needs to be something you can handle online!
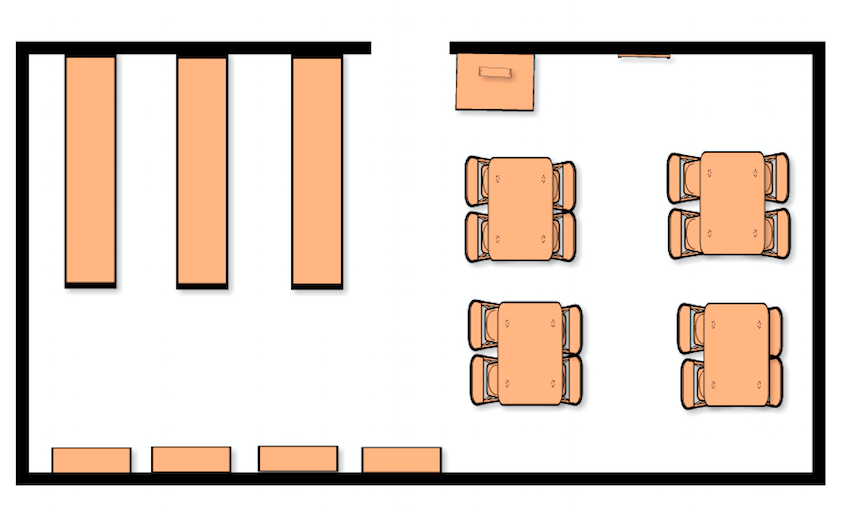
Our first step was to create a map of the library. If your space is a nice square or rectangle, this is actually not that hard. Having just completed a kitchen renovation, I was pretty familiar with the many free online floor plan tools available. Most even have furniture that you can drop into the space - they may not have circulation desks, but a book shelves and tables are pretty standard items. But there are actually tools out there designed to help librarians design spaces - this one, from The Library Store, is pretty simple to use and allows you to find representation of some library-specific pieces of furniture. Magazine display racks anyone? Remember, the goal here is not to come up with something for an architect to use, it’s just to give an idea of the general layout.
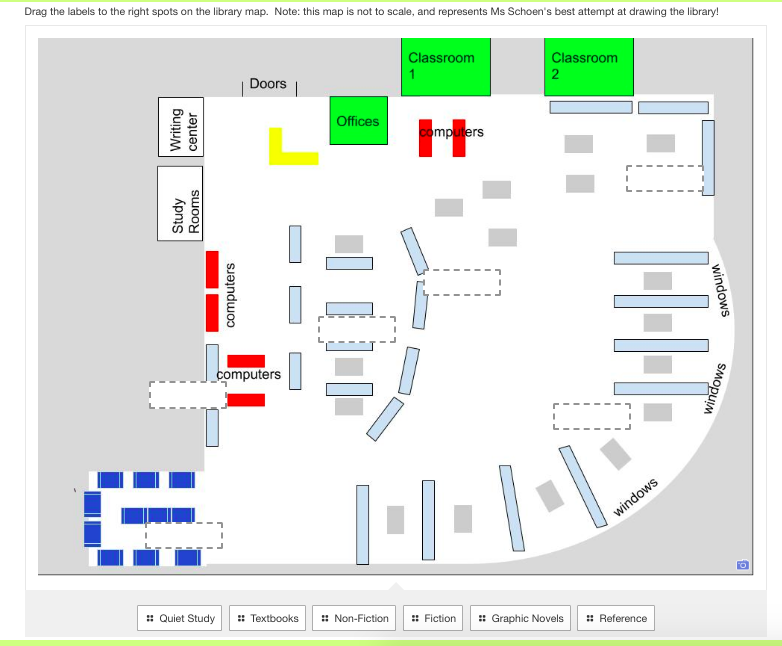
Our library was tricky - it’s a large space with lots of nooks and crannies, a quiet study are that bends around a corner, and study rooms, classrooms, and a writing center that jut off at off angles. So I made a crude representation using Google Draw (I majored in engineering in college and I could feel my drafting professor judging me, but sometimes you just have to make do!).
Here’s how the mapping activity works:
- Students will make a digital copy of the map you created
- Using image editing software, they fill in the blank spaces
- Students share their finished work back with you
Our school Learning Management System (Schoology) actually has an assessment tool designed for labeling pictures, (imagine those ”label the parts of the cell” worksheets) so that was the obvious choice for us to use. But don’t worry if you don’t have this software! There’s a few ways you can do this using basic software.
Here are a few suggestions for creating the labels and answers:
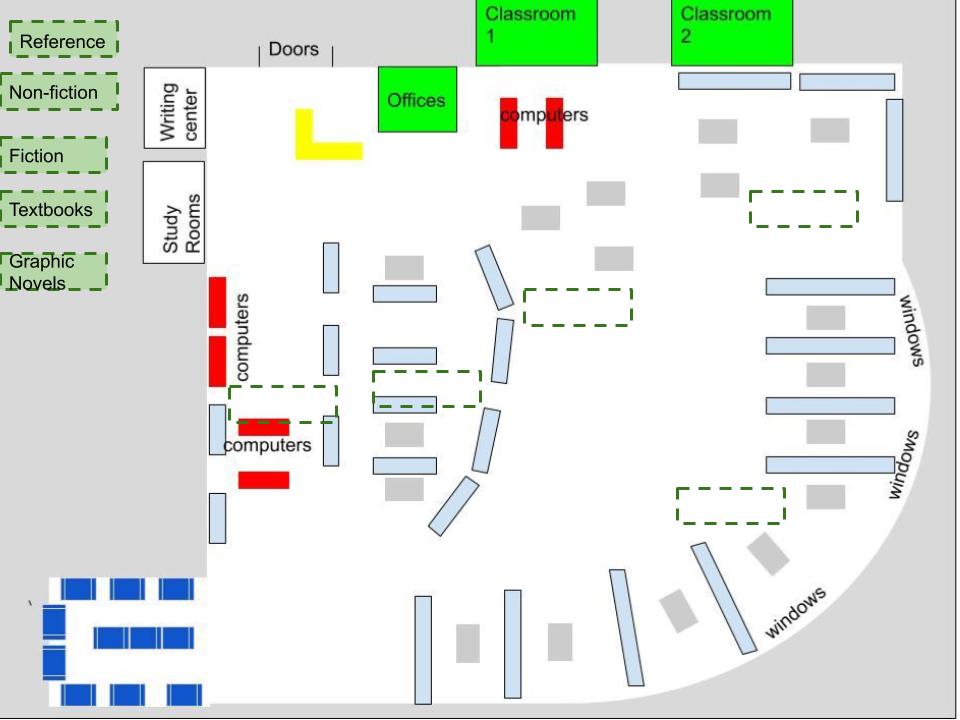
Google Draw comes to the rescue again. Upload a copy of your map as an image to use as background. Using the shapes tool, create blank label spaces. Then create labels that students can drag and drop onto the blank spaces.
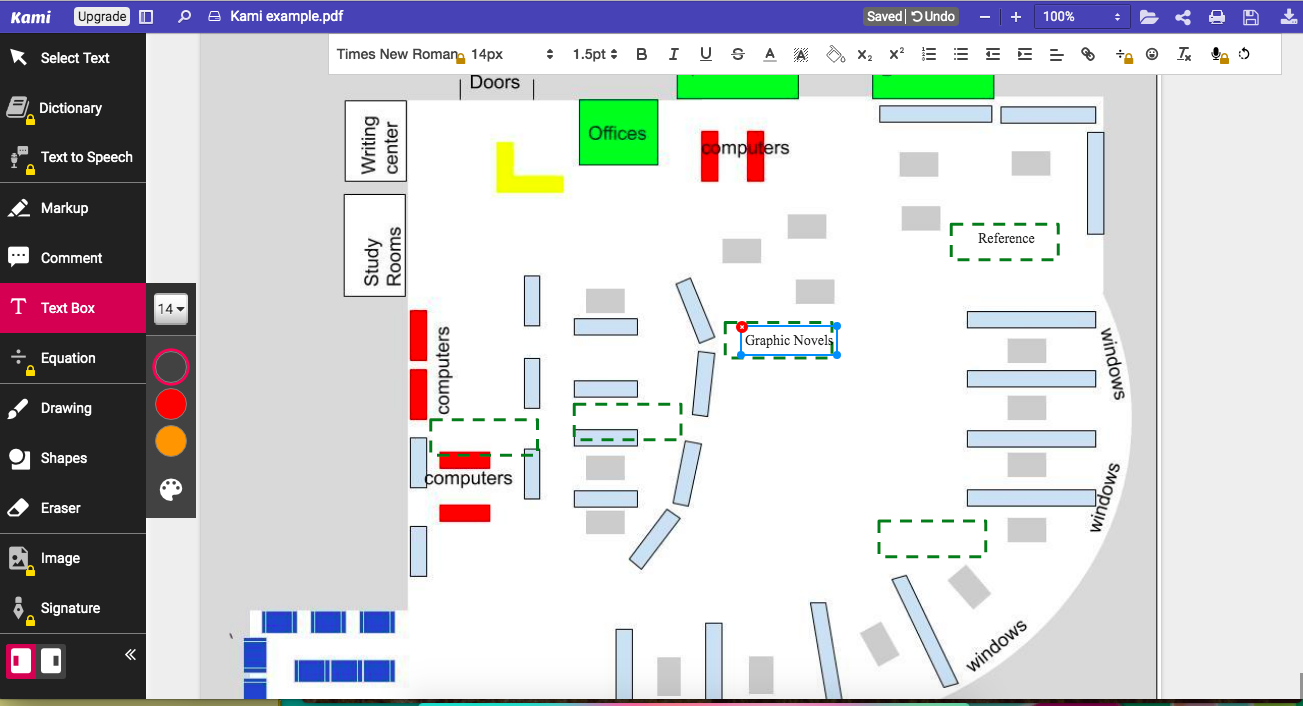
Kami, a Chrome plugin I’ve mentioned before, allows you to edit PDF documents. Just upload your drawing as a PDF and have students type their answers in the blank spaces with a text box.
Other options to annotate images: Evernote, Powerpoint - basically any tool that allows you to draw shapes and add text. Have the students copy your picture, edit the labels, and then share back with you.
- Some of this is actually just measuring how well students can read a map! Navigating through a two dimensional space - as opposed to following a GPS navigation - is a skill most teens (and many adults) are not familiar with. To help with this, give students a way to orient themselves; after the first class got lost I realized it would help to project the map on the classroom screen and give them a “You are Here” pointer to start.
- Think about how your map is drawn - I put the library classrooms at the top of our map. But that meant when students left the classroom to go explore the library, they basically had to turn the computer around to get the map facing the right direction!
- Some of my labels were unclear - fiction was right next to graphic novels, which students consistently mixed up. That was a bad question, not a lack of understanding.


